This news concerns administrators and supervisors of company accounts with activated territory optimization.
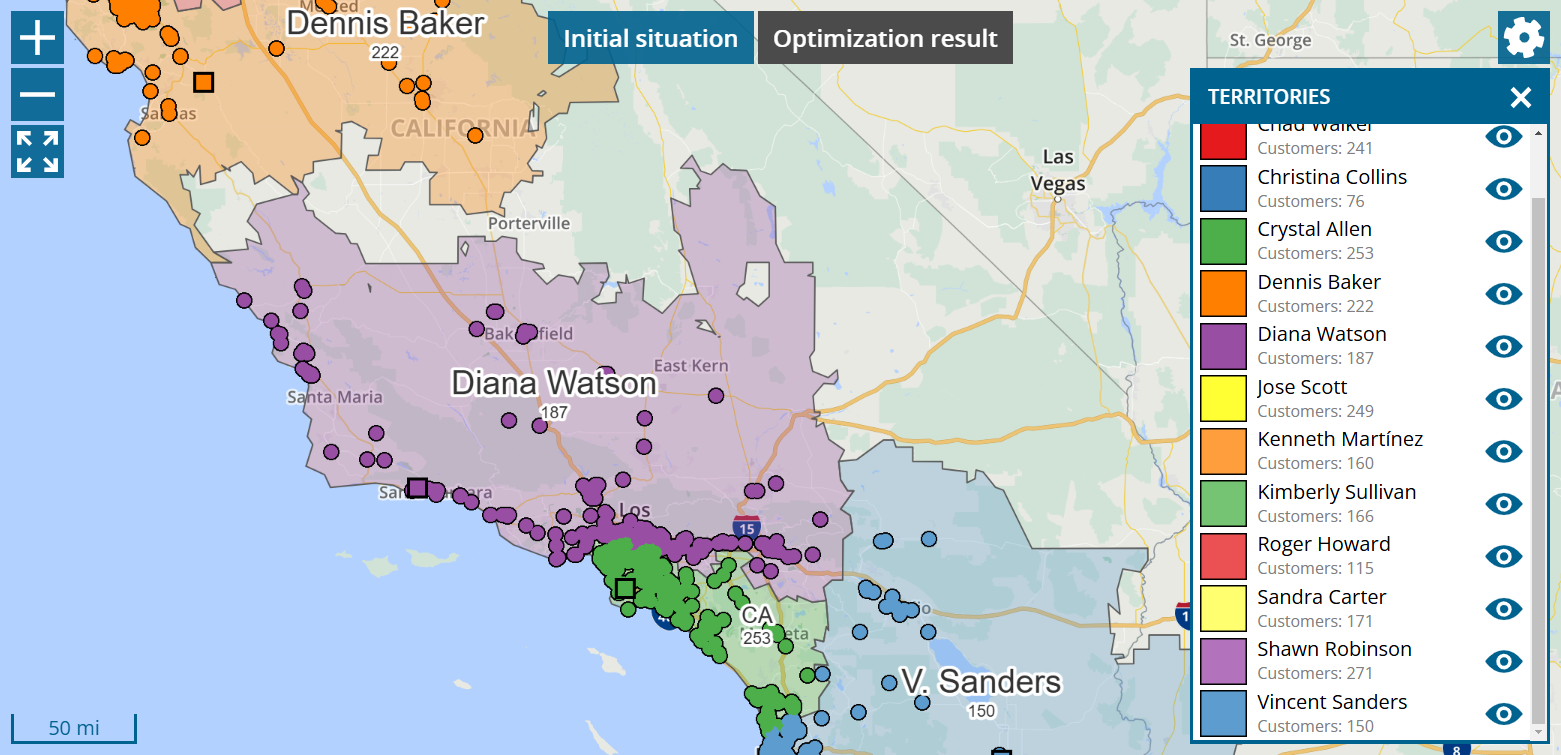
The display of the territory surfaces is available in each map of the territory optimization.
Click on the cogwheel at the top right and switch to “Display: Customers + areas” or “Display: Areas”.
portatour® uses zip code boundaries when coloring areas. If there are several customers of several users in one zip code, it is assigned to the user that has the most customers there.
Depending on the space available, the area name is displayed complete or abbreviated.
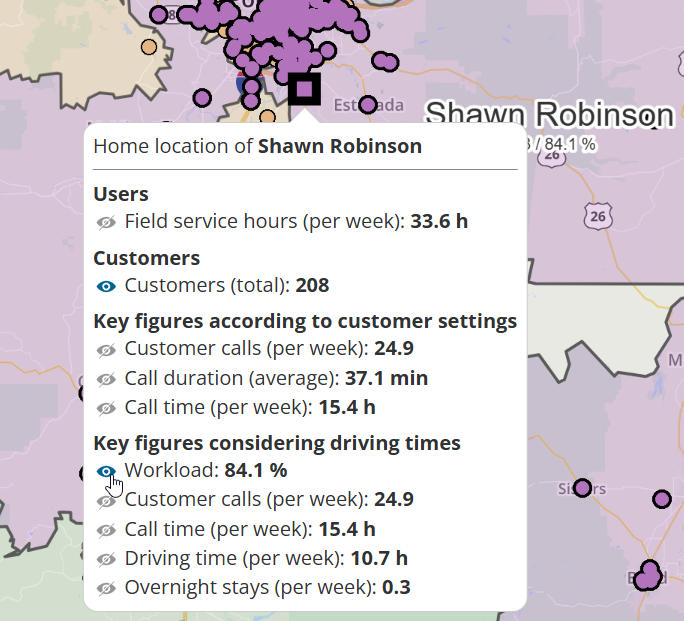
Selectable key figures can be displayed below the area name. The number of customers in the area is displayed by default. To display other key figures, proceed as follows:
- Click on any territory to select it.
- Click again on the territory or on the home location to open the corresponding information bubble.
- Click on the eye symbol next to the desired key figure to show or hide it again on the map.
Up to three key figures can be displayed simultaneously.


