Do you want to see your customers or other addresses on a map? Is your data currently in an Excel file or within a customer relationship management system (CRM/ERP)? Using portatour® sales-route mapping software, it’s a breeze to import your address data, automatically geocode it, and show it on a map. Colors can be used to indicate a customer’s revenue, industry, call frequency, or other criteria. Additionally, an individual symbol can be assigned to each customer. If you do field sales and visit the customers, portatour® can calculate an optimized route for you. Read on to find out the possibilities that portatour® route mapping software offers for geomarketing and route-planning.
Show customers and addresses on a map
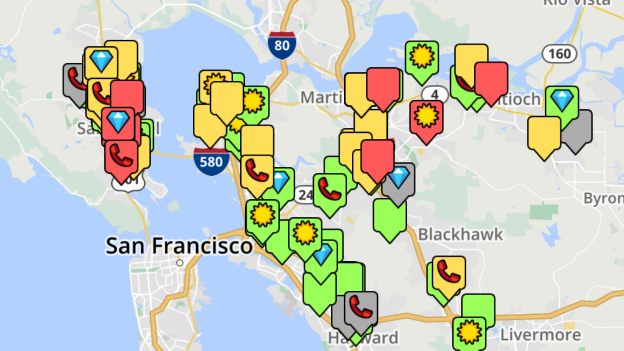
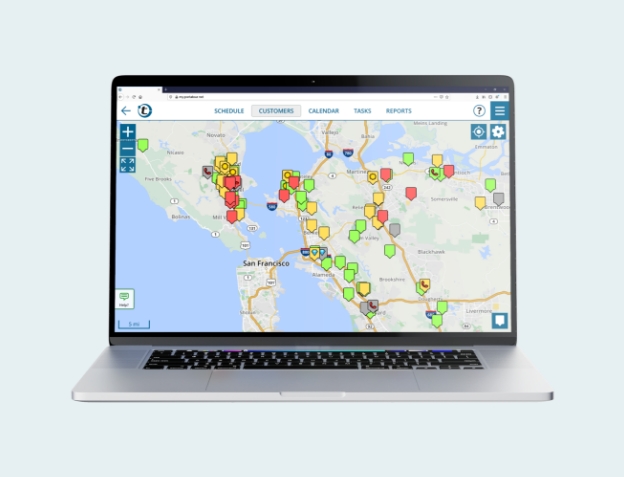
In this first example, you see customer data imported from an Excel file displayed on a map. Customers are colored by “urgency for field sales”: customers ripe for a visit are yellow and red; customers recently visited are green. Additional symbols indicate important customers.
Start today with portatour® – no download or installation needed
portatour® is a web-application running in all modern web-browsers. No time-consuming download of software or map material is needed. You don’t need to install portatour® either. Just get your free trial account online, then follow the steps below to show customers on the map.
Show customers on map with portatour®!
Importing data from Excel or from a customer database (CRM/ERP)
portatour® supports importing addresses from Excel, OpenOffice, and text/CSV-files. An import wizard guides you step-by-step through the customer import process. portatour® is adaptive when importing data: the columns in the imported file do not have to conform to a predefined schema. Rather, the columns of the file are matched to the fields in portatour® once during the import process. Alternatively, customer data can be imported directly from Salesforce, Dynamics CRM and other CRM/ERP systems. Learn more about importing customer data.
Accessing data via PC, smartphone, tablet
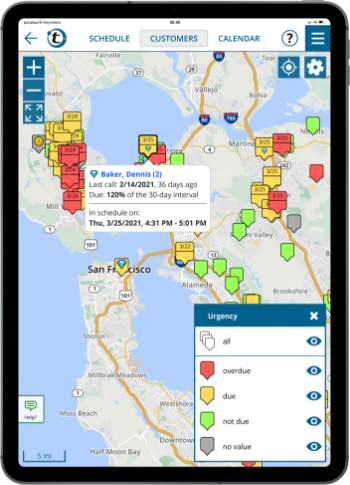
Once imported, your customer data is stored in the portatour® cloud and can be accessed on each and any of your devices: desktop PC, notebook, tablet, and/or smartphone. You get an overview of your customer data and can show your customers on a map from any device. For example, on a tablet:
Coloring based on data – “painting by numbers”
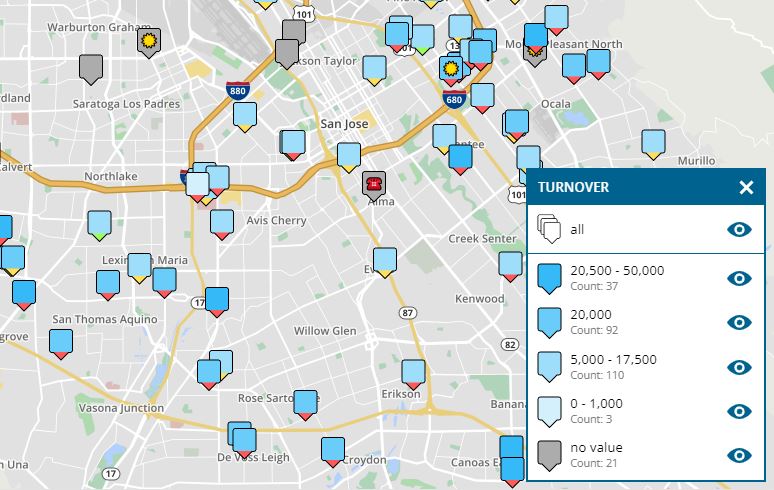
In addition to importing addresses, portatour® supports importing custom fields. Import data regarding the revenue, industry, potential, call frequency, etc. of your customers to color them according to these criteria on your map. In the following example, the customers are shown by revenue-class. Important customers with higher turnover are darker.
Individual customer symbols
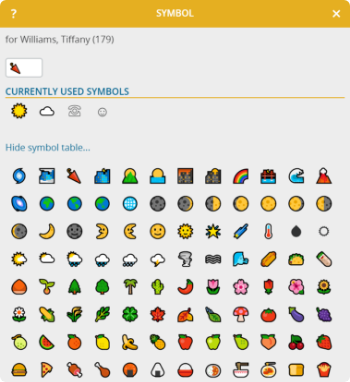
Assign meaningful symbols to each customer. portatour® offers hundreds of different symbols. You can also import them – all characters from the UTF-8 character set are supported:
Complex filters made easy
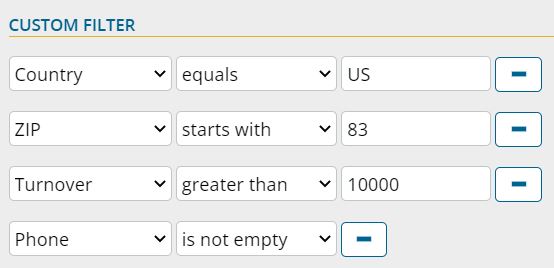
Do you want to see only certain clients and show those customers on map? Create a custom filter in a minute. For example, when planning a campaign for all customers from ZIP-code 83* with revenue above $10,000 and where you know the phone number, create a filter:
portatour®: Much more than geomarketing & showing customers on a map
This article only provides a brief introduction to how you can display and show customers and Excel addresses on a map. portatour® is also a route planner for field reps and outside sales.
It automatically calculates how to visit as many customers as possible with minimal driving time. Easy entering of call reports and auto-generated performance-statistics make portatour® the perfect tool for mobile field representatives.
Read more about the portatour® sales route mapping software at www.portatour.com .

